All Categories
WhatsApp AI for Re-Engaging Dormant Leads: A Playbook
Learn how to use WhatsApp AI to re-engage dormant leads, revive stalled conversations, boost conversions, and turn missed opportunities into revenue..
DBSCAN (Density-Based Spatial Clustering of Applications with Noise) is a popular learning method utilized in model building and machine learning algorithms. This is a clustering method that is used in machine learning to separate clusters of high density from clusters of low density. Clustering analysis or simply Clustering is an unsupervised learning method that divides the data points into several specific batches or groups, such that the data points in the same groups have similar properties and data points in different groups have different properties in some sense.
DBSCAN can also sort data into clusters of varying shapes, another strong advantage. DBSCAN works as such:
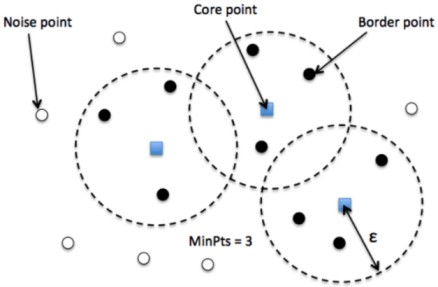
The main idea behind DBSCAN is that a point belongs to a cluster if it is close to many points from that cluster.There are two key parameters of DBSCAN:
These parameters can be understood if we explore two concepts called Density Reachability and Density Connectivity.
Based on these two parameters, points are classified as core points, border points, or outliers:
Algorithms start by picking a point(one record) x from your dataset at random and assign it to cluster 1. Then it counts how many points are located within the ε (epsilon) distance from x. If this quantity is greater than or equal to minPoints (n), then consider it as core point, which then pulls out all the ε-neighbours to the same cluster 1.
It will then examine each member of cluster 1 and find their respective ε -neighbours. If some member of cluster 1 has n or moreε-neighbours, it will expand cluster 1 by putting those ε-neighbours into the cluster. It will continue expanding cluster 1 until there are no more examples to put in it.
In the latter case, it will pick another point from the dataset not belonging to any cluster and put it into cluster 2. It will continue like this until all examples belong to some cluster or are marked as outliers.
If there are at least ‘minPoint’ points within a radius of ‘ε’ to the point then we consider all these points to be part of the same cluster.
The clusters are then expanded by recursively repeating the neighbourhood calculation for each neighbouring point.
DBSCAN is broadly used in many applications such as market research, pattern recognition, data analysis, and image processing. Clustering can also help marketers discover distinct groups in their customer base. And they can characterize their customer groups based on the purchasing patterns. Density-based spatial clustering of applications with noise (DBSCAN) is a well-known data clustering algorithm that is commonly used in data mining and machine learning.
The easier-to-set parameter of DBSCAN is the minPts parameter. Its purpose is to smooth the density estimate, and for many datasets, it can be kept at the default value of minPts = 4 (for two-dimensional data). The advantage of this is great at separating clusters of high density versus clusters of low density within a given dataset and is great at handling outliers within the dataset.
The silhouette score is calculated utilizing the mean intra-cluster distance between points, AND the mean nearest-cluster distance. A silhouette score ranges from -1 to 1, with -1 being the worst score possible and 1 being the best score. Silhouette scores of 0 suggest overlapping clusters.
Inertia measures the internal cluster sum of squares (the sum of squares is the sum of all residuals). Inertia is utilized to measure how related clusters are amongst themselves, the lower the inertia score the better. However, it is important to note that inertia heavily relies on the assumption that the clusters are convex (of spherical shape). DBSCAN does not necessarily divide data into spherical clusters, therefore inertia is not a good metric to use for evaluating DBSCAN models (which is why I did not include inertia in the code above). Inertia is more often used in other clustering methods, such as K-means clustering.

All Categories
Learn how to use WhatsApp AI to re-engage dormant leads, revive stalled conversations, boost conversions, and turn missed opportunities into revenue..

Conversation AI
Explore the rise of silent commerce and how customer preferences are shifting toward messaging, while voice continues to play a key role in engagement.

AI Agents
Compare Voice AI and IVR costs beyond setup and licensing. Learn how automation, containment rates, customer experience, and scalability impact ROI for you.