Drive to Reimagine
How chatbots have evolved with data and AI
We've evolved from using rules-based chatbots to exploring more sophisticated chatbots because of data, AI, and NLP. Explore the history and uses in this blog.
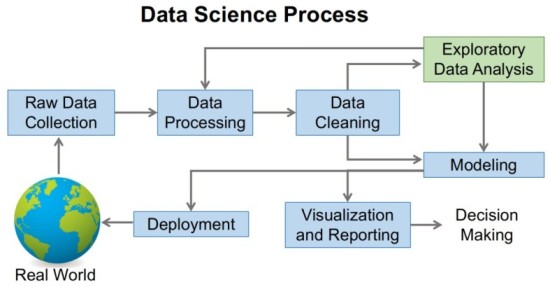
Exploratory data analysis (EDA) is pretty much the first step in the process of data analysis. It is utilized by researchers, data analysts, and data scientists to enable them to investigate and understand a dataset and summarize it contents and main characteristics, especially when they are trying to solve for a particular question or prepare more sophisticated and advanced data modeling in later stages of data analysis.
Data visualization methods are generally used for the summarization of main characteristics.
EDA helps you figure out the best way to manipulate data sources so that you can find all the answers that you need, thus simplifying the data scientists’ jobs and helping them discover patterns, detect anomalies, test & verify hypotheses, or check assumptions.
It gives you to context that you need to develop an appropriate model and interpret the results in the right way.
Here the data being analyzed has just one variable. It is essentially the simplest form of data analysis. Because there is just a single variable, univariate non-graphical data does not deal with causes or relationships. It’s main purpose is to describe the data and detect the patterns in it.
Graphical methods are needed because non-graphical methods do not give you a full picture of the data. Some widely used kinds of univariate graphics are:
Multivariate data comes from more than one variable. Multivariate non-graphical EDA techniques tend to depict the relationship between two or more variables of the data by means of cross-tabulation or statistics.
This involves using graphics on multivariate data for the purpose of displaying relationships between multiple sets of data. The grouped bar plot is the widest used graphic. It is a bar chart in which every group represents one level of one of the variables and every bar within a group representing the levels of the other variable.
Some widely used types of multivariate graphics are:
Researchers make use of exploratory data analysis because it helps them make sense of the data that they have access to, helping them figure out which questions should be asked, how they should be framing those questions, and the manner in which they should approach survey respondents to help them discover information and insights that they think are missing.
Data analysts use exploratory data analysis since it helps them:
Get your WhatsApp chatbot at just $5 a day
Start nowThe main goal of exploratory data analysis is to maximize the insights that a data analyst can get from a dataset and the underlying structure of a dataset. It’s aim is to inspect and analyze a dataset without assuming anything about its contents.
This allows them to recognize patterns and potential causes for observed behaviors without being bound by assumptions.
It helps them answer questions that interest them or inform decisions about the statistical model that would be most appropriate to use in future stages of data analysis.
Some advantages of exploratory data analysis are:
The main goal of exploratory data analysis is to help you understand the data in a more comprehensive manner and use tools effectively to glean useful insights or draw conclusions.
Python and R are the mostly commonly used data science tools that were used to create an exploratory data analysis.
This is an interpreted object-oriented programming language that has dynamic semantics. It has high-level, built-in data structures and dynamic typing and dynamic binding, which makes it very appealing for rapid application development and and as a scripting or glue language for the purpose of connecting existing components to each other.
By using Python and EDA together, you can detect values that are missing in a dataset, which would help you figure out how to handle missing values for machine learning.
This is an open-source programming language and a free software environment for statistical computing and graphics that is supported by the R Foundation for Statistical Computing.
It is commonly used by statisticians in data science for the purpose of developing statistical observations and data analysis.

Drive to Reimagine
We've evolved from using rules-based chatbots to exploring more sophisticated chatbots because of data, AI, and NLP. Explore the history and uses in this blog.

Tech Corner
Data is currently scattered in most enterprises. Data scientists & developers are working on a common framework. Read on to learn how chatbots are helping!

Tech Corner
Data Science, coined back in 2008, is taking the world by storm! Revolutionary as it is, it is creating some confusion, so we’re covering the basics.